
The issues facing the oil industry can be summed up via a quote that recently appeared on Bloomberg:
“Asset managers bought the story that we’d have $100 oil forever,” said Tim Gramatovich, chief investment officer with Peritus Asset Management in Santa Barbara. “Bondholders are left holding the bag.”
Is The Oil Bounce Running Into Resistance?
The trendlines on the weekly oil chart below were drawn and presented on January 22, 2016. As you can see, oil has rallied back to a logical level in recent weeks, but it has thus far failed to break the downtrend that began in late 2014. Oil rallied back to the same trendline on two other occasions (red arrows). In both cases, the rally ended and crude oil resumed its primary and bearish trend.
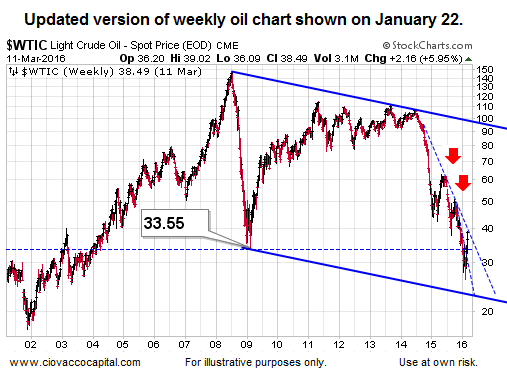
We will learn something either way near the trendline shown above. If oil breaks to the upside and prints a weekly close above the trendline, the odds for the crude oil rally continuing will improve. If oil reverses this week, it is possible the countertrend rally has come to an end. Time will tell.
Have Longer-Term Stock Trends Improved?
This week’s stock market video covers twenty-one long-term trends including oil (USO), energy stocks (XLE), emerging markets (EEM), S&P 500 (SPY), Dow (DIA), and NASDAQ (QQQ). 2016 charts begin at the 14:50 mark.
Oil’s Impact On Stocks And Bonds
The oil business requires quite a bit of capital investment (rigs, tankers, storage facilities, refineries, etc.). Therefore, access to the credit markets is important. With oil industry revenues being adversely impacted by low oil prices, it is getting harder for some companies to service and refinance their debt. The examples below were highlighted by Bloomberg on March 11, 2016. Missed interest payments and potential defaults include:
- Energy XXI, with $2.875 billion in debt, and SandRidge Energy, which owes $4.131 billion, both failed to pay interest due Feb. 16 and will default unless they reach agreements with their creditors by March 17.
- Ultra Petroleum, which owes $3.197 billion, said last week it has until April 30 to hammer out a deal with its lenders.
- Goodrich Petroleum, which owes $455 million, said this week that it won’t pay interest due March 15 and April 1, and that it’s asking bondholders and shareholders to participate in a restructuring plan.
- Chaparral Energy Inc., with $1.798 billion in debt, missed a payment on March 1, starting the clock on a 30-day grace period.
- Pacific Exploration & Production Corp., with $5.428 billion in debt, likewise has until the end of the month under an extension granted by its creditors.
- Venoco Inc., facing $708 million in debt, skipped an interest payment last month. The company must cut a deal with creditors by March 17.
- Warren Resources Inc., which owes $453 million, said last month that it may file bankruptcy without a creditor deal. The company faced a default on March 2, when a 30-day grace period for a missed interest period had been set to expire.
Other Relevant Oil Charts
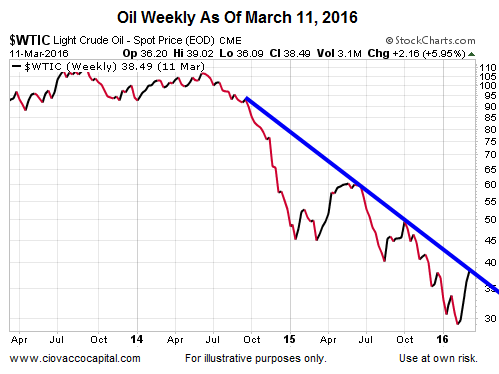
If we zoom in on a weekly chart, it is easier to see the area of possible resistance for crude oil.
A daily chart using high/low/close paints a similar “we should learn something soon about the oil rally” picture.

Investment Implications – The Weight Of The Evidence
A multiple week countertrend rally is not uncommon during a long-term downtrend. For example, the 2000-2002 bear market experienced four countertrend rallies that lasted four weeks or more. In the 2007-2009 bear market, stocks rallied for four weeks or longer three times. If the S&P 500 can clear and hold the levels described in this video clip, the odds for a longer-term trend reversal will improve. Under our approach, we are always open to improvement. However, we want to see improvement rather than anticipate it.